1. Client Settings
- The number of Items and tabs displayed on the Grid - The more items and tabs you display the longer it will take to not only show the results, but it can affect your Ticket Save time since Footprints 12 refreshes the grid after a ticket save. Change the number of items displayed to a smaller number (10 or 25) and reduce the number of tabs to see if performance is better.
- Default "All Items" View - As above, the "All Items" view will show all container items you have access to. This is good for training and testing, but not recommended for production usage. The recommendation is to create your own search views. If you need to use the "All Items" view, go into the Administration>System Management>System Settings>Miscellaneous page and reduce the "Max Item Type Loaded for Default Search" to a lower number.
2. Software and Hardware
- Verify that the server and database server environments meet the product's software and hardware requirements (e.g. OS versions, database versions, memory, etc.) for the applicable FootPrints version.
Footprints 12.1.x System Requirements
- It is important that the database server hardware, in particular, includes or is configured for optimal input/output (I/O) speed of its hard disk(s). Some database technologies even prescribe specific ways to stripe hard disks for high-performance environments.
- Identify the impact of other applications running on the same server instances (both application and database servers) as FootPrints (e.g. other applications using the same database instance.)
- Verify that anti-virus software is not slowing things down. Be sure to exclude the 'web', 'conf', and 'logs' folders (located in the FootPrints Installation directory) from Active / On-Access Scanning.
- For Microsoft Windows installations only, OS patch KB2992611 (MS14-066) has been verified to cause major performance problems in Microsoft Access and SQL Server applications. The recommendation is to remove this patch from the affected systems. A description of the patch can be found at http://support.microsoft.com/kb/2992611. Additional details can be read here.
3. Virtualized Environments
- When running on virtualized environments, verify that the Virtual Machine (VM) configuration is optimal.
The following link provides VM tuning considerations for a different product but can also apply to a FootPrints virtualized environment:
http://www.symantec.com/business/support/index?page=content&id=HOWTO7692
- In addition to adequate CPU and memory allocation, it is important that disk I/O is monitored and tuned on a continuing basis (e.g. virtual and physical disk fragmentation). This is particularly important for the VM where the database server runs since database operations can be heavily disked I/O bound. Some database technologies even prescribe specific ways to stripe hard disks for high-performance environments.
- Avoid, if possible, setups that use mounted/shared drives to minimize reliance on the network (virtual or physical.)
4. Network
- Analyze the health of the network(s) being used by the different FootPrints clients and also between the different back-end systems being accessed by the FootPrints application server (e.g. connectivity to the database server, LDAP server, email server, other database systems accessed through dynamic imports, etc.)
- Verify that network bandwidth utilization across network segments is appropriate, that network latency is optimal, and that network hardware is (e.g. routers, switches, network cards, wireless hotspots, VPN, etc.) are performing adequately. The use of suitable network monitoring tools is recommended.
- Determine if network traffic from other applications or systems that have nothing to do with FootPrints could be causing latency spikes.
- FootPrints configurations to support "Web Server Authentication" effectively force an additional network hop before requests reach the FootPrints Tomcat instance. Verify that such configurations are optimally supported by the underlying network. Proper configuration of network Firewalls could be a concern.
5. Tomcat Configuration
- Verify the Tomcat Configuration as per the following technical article. Pay close attention to memory configuration settings and recommendations to manage the size of Tomcat log files.
How to configure Tomcat for FootPrints Service Core
- Consider rebooting the Tomcat service regularly (once a week) to avoid memory leaks and memory over consumption issues: How to automate Tomcat Service reboot ?
- Consider enabling response data compression, particularly if network bandwidth limitations exist. See the previously mentioned article for configuration steps.
- Consider installing the Apache Portable Runtime library to maximize Tomcat performance in production environments. See more information here:
http://tomcat.apache.org/tomcat-7.0-doc/apr.html
- Identify the impact of other Tomcat web apps running on the same Tomcat instance as FootPrints.
- Reduce Tomcat Startup time: Tomcat is scanning all folders within the application and its own folders, looking and scanning for jar files. Simply preventing Tomcat from scanning the files is easy and we just need to modify the Catalina.properties file and set those values (comment out the lines which are not already commented out using "#" sign. The final section of the file should look exactly like this :
tomcat.util.scan.DefaultJarScanner.jarsToSkip=*
#bootstrap.jar,commons-daemon.jar,tomcat-juli.jar,\
#annotations-api.jar,el-api.jar,jsp-api.jar,servlet-api.jar,websocket-api.jar,\
#catalina.jar,catalina-ant.jar,catalina-ha.jar,catalina-tribes.jar,\
#jasper.jar,jasper-el.jar,ecj-*.jar,\
#tomcat-api.jar,tomcat-util.jar,tomcat-coyote.jar,tomcat-dbcp.jar,\
#tomcat-jni.jar,tomcat-spdy.jar,\
#tomcat-i18n-en.jar,tomcat-i18n-es.jar,tomcat-i18n-fr.jar,tomcat-i18n-ja.jar,\
#tomcat-juli-adapters.jar,catalina-jmx-remote.jar,catalina-ws.jar,\
#tomcat-jdbc.jar,\
#tools.jar,\
#commons-beanutils*.jar,commons-codec*.jar,commons-collections*.jar,\
#commons-dbcp*.jar,commons-digester*.jar,commons-fileupload*.jar,\
#commons-httpclient*.jar,commons-io*.jar,commons-lang*.jar,commons-logging*.jar,\
#commons-math*.jar,commons-pool*.jar,\
#jstl.jar,taglibs-standard-spec-*.jar,\
#geronimo-spec-jaxrpc*.jar,wsdl4j*.jar,\
#ant.jar,ant-junit*.jar,aspectj*.jar,jmx.jar,h2*.jar,hibernate*.jar,httpclient*.jar,\
#jmx-tools.jar,jta*.jar,log4j.jar,log4j-1*.jar,mail*.jar,slf4j*.jar,\
#xercesImpl.jar,xmlParserAPIs.jar,xml-apis.jar,\
#junit.jar,junit-.jar,hamcrest.jar,org.hamcrest*.jar,ant-launcher.jar,\
#cobertura-.jar,asm-.jar,dom4j-.jar,icu4j-.jar,jaxen-.jar,jdom-.jar,\
#jetty-.jar,oro-.jar,servlet-api-.jar,tagsoup-.jar,xmlParserAPIs-*.jar,\
#xom-*.jar
org.apache.catalina.startup.TldConfig.jarsToSkip=*
org.apache.catalina.startup.ContextConfig.jarsToSkip=*
-
for Centos 7 and PostgreSQL DB :
to avoid failing during running BPT Import tool.
BPT export tool stores double-byte containers names as question marks on Postgres DB:
Add additional parameter to tomcat's setenv.sh file (
{CATALINA_HOME}
/bin/setenv.sh):
export LC_ALL=en_US.utf8
6. Client Browsers
- Identify the types of client browsers being used. It is a known fact that browser performance is not consistent across browser vendors. The Chrome browser typically excels in its performance. Older versions like Internet Explorer 8 may have performance issues outside the control of the FootPrints client-side software.
- Consider using the Chrome browser for troubleshooting issues for its superior debugging capabilities.
- Recommend that clients evaluate the impact of third-party browser plugins on browser performance. For example, on Firefox having the FireBug plugin enable could certainly slow things down a bit.
- The latest versions of Microsoft Internet Explorer (i.e. Edge) may be running by default in a mode that may cause noticeably long page load times. If other browsers (i.e. Chrome, Firefox, etc.) do not exhibit such long delays then it could be a compatibility issue with Edge. One way to address such issues is to add the following HTML directive to the FootPrints application.html file:
<meta http-equiv="X-UA-Compatible" content="IE=Edge" />
Such entry must be specified right after the <head> element as shown in the following snapshot:
NOTE: This change to the application has been applied to the Footprints 12.1.03 service pack 3 updates.
See the list of new features: Footprints 12.1.03
7. Application Server
-
Upon an initial start or restart of the FootPrints application server (i.e. Tomcat), or the database server for that matter, there will be an initial period of time when system responses will be slow or slower than normal. This initial slowness should be expected and has to do with the system progressively loading up data into memory and caching information. As users continue to use the application, the server will stabilize and performance should resume normal levels. If after a few minutes of system use performance continues to be slow or perhaps worsens then it would be a reason for concern.
-
Coordinate when changes to the container (e.g. workspaces) or items? definitions (e.g. tickets? definitions) are to be published to avoid doing them when users are actively accessing the system.
-
Analyze the complexity and number of client and server-side rules, including associated workflows. Client hardware and server hardware might need to be adjusted to adequately support the load. Alternatively, changes to the design of the rules/workflow could be considered to keep processing requirements less taxing on the system.
- Consider increasing the number of threads available for processing Time-Based Rules if the total number of Time-Based Rules that execute at the same time is large or there are many Time-Based Rules that perform complex tasks like creating new tickets. The number of threads available for processing Time-Based Rules can be configured in the Administration Console under System Management / System Settings / Miscellaneous. The default value is 10 threads and should be sufficient for typical deployments. Increasing this number does not necessarily guarantee that all Time-Based Rules will be executed faster; it depends on how many rules actually end up executing concurrently and their complexity.
- Depending on when specific Time-Based Rules are set up to run, the number of rules whose execution schedule happens to coincide is divided amongst the number of threads specified. For example, if a deployment has 3 workspaces with a total of 40 Time-Based Rules, and at a given time 30 of those rules need to execute then 30 rules divided into 10 threads results in 3 rules executed in each thread. The number of threads that can be specified depends on the operating system, platform, and available hardware resources (i.e. CPUs and memory) allocated to the FootPrints application server (i.e. Tomcat.)
- Use caution when increasing the number of threads for it may in turn negatively impact the performance of other parts of the application if hardware resources allocated to the FootPrints application server (i.e. Tomcat) are insufficient to deal with the increased processing load.
- Verify that the frequency and size of imports (scheduled or not) are non-impacting or not a concern.
-
Verify that the number of Link Controls specified on an Item form is kept to a minimum. The impact is noticed on form load because of the additional processing needed between "linked?" tabs. As a rule of thumb, estimate that the impact on form loading will be about 1 second for each Link Control added.
-
Verify that the checking/running interval of time-based rules is not exceedingly short.
-
Verify that Incoming Email debugging has not been left enabled in the Administration Console. This will write to the Footprints.log file causing extra work on the server.
- Inspect the contents of the logs/footprints.log file for indications that a large number of warnings or errors are being frequently logged so the causes can be addressed. Verify also that the logging level in the logging-enabling page of the Administration Console or in the conf/log4j.properties file has not been unnecessarily left enabled as part of some other [functional] troubleshooting efforts. One way to verify this also is to look at the amount and frequency of logging in the footprints.log file.
- Verify that frequently executed Service Analytics Reports are configured in an optimal way. It is always preferable to use a saved search to filter the set of container items that a report will analyze to the smallest set necessary. If you do not specify a saved search, all container items will be loaded into the report even if only a subset is shown because the filtering will be done in the report itself. This can cause a relatively simple report to be much slower than filtering using a saved search first and then using the report filters only for final adjustments to the shown data.
- Verify that any widgets that load a chart from Service Analytics are not referencing slow loading reports. Having several chart widgets all executing large reports at the same time can cause a significant load on the application server CPU.
- Be aware that modifying in any way the Work Schedule associated with a workspace will force all summarized reporting data to be recalculated. This recalculation will be done for each container item defined in the workspace(s) that use the changed Work Schedule. If you have a single Work Schedule associated with many workspaces and those workspaces contain many items, this could be a large number of recalculations that could possibly impact the performance of the system. For this reason, if you have a single Work Schedule and many workspaces/items, you should plan changes to the Work Schedule during times of low activity in the system.
- Verify acceptable performance of saved searches that are likely to be run frequently by running them manually in the application. Using a slow search in a rule, console widget, scheduled report, or sharing it for frequent use can cause overall performance degradation of the system. If a saved search is not returning results in a reasonable time then refer to "Search Tips" in the application to help to investigate options to improve search execution.
-
If the Tomcat installation used by FootPrints is integrated with IIS 7 or IIS 8 and errors occur uploading file attachments larger than 30MB, view "Invalid response - Unable to decode server's response to JSON" error occurs when attempting to upload attachment larger than 30MB to address the problem.
-
In high-volume environments, the number of Active Definition Version objects can grow significantly. For better performance of the item runtime (e.g. creating or updating tickets), a cache of Active Definition Version objects is used. Slowdowns in the time it takes to create or update items could be caused by many reasons, one of which could be that the number of Active Definition Version objects has grown so large that not all the objects could be cached. To check for this condition, run the following SQL query on the database:
- select count(*) as ActiveDefinitionVersionsCt from fpscdb001_system.v_defn_ver_active
-
If the result is well under 100,000 then the size of the Active Definition Version cache is not the problem. On the other hand, if the result approaches or exceeds 100,000 then it is recommended that the Active Definition Version cache size is increased progressively in multiples of 25,000 as appropriate.
-
The Active Definition Version cache size setting can be changed in the footprints-core-beans.xml configuration file found in the conf folder of the FootPrints installation. Find the following entries in the file and change the value highlighted below accordingly:
<bean id="activeDefinitionVersionCacheSize" class="java.lang.Integer">
<constructor-arg value="100000"/>
</bean>
IMPORTANT: Increasing the Active Definition Version cache size will mean that more objects will be kept in memory. For this reason, it is important that the amount of RAM available in the system and the amount of maximum memory configured for the Tomcat process (i.e. JVM –Xmx setting) are checked to make sure they appear sufficient to support the application.
8. Database Server
- Follow the recommendations in the following article:
- Verify proper database configuration and setup. There are many database settings for each platform that are critically important, such as, the amount of memory used, the product edition and version, the number of processors used, set of enabled features, disk striping considerations, etc.
- Implement an adequate database maintenance plan. Some parts of the plan may be configuration-driven (i.e. automated) while others require manual tasks. Plan details vary by database platform.
-
Please find an article for Database Re-indexing : Database Re-indexing
-
Wildcard full-text searches in the PostgreSQL database are known to perform poorly. This is due to the limitations of the database engine and not of FootPrints. The recommendation at this time is to avoid this type of search on PostgreSQL.
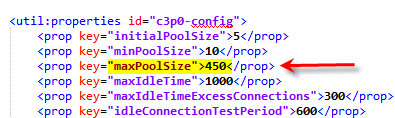
- Verify that the database server is configured to accept at least 450 connections for each FootPrints instance that uses it.
- The FootPrints application server by default is configured to use up to 450 connections. The database server must be configured accordingly; otherwise, performance will be affected. Note that by increasing the number of connections on the database server, the database host will experience increased CPU, memory, and I/O activity so make sure the hosting hardware adequately supports the additional processing load. The connection pool size of the FootPrints application server is externally configurable to allow fine-tuning of the specific operational environment. The configuration file is called footprints-das-provider.xml and is found in the FootPrints conf installation folder under the appropriate database platform subfolder. The following snapshot shows the default maxPoolSize setting:
 http://msdn.microsoft.com/en-us/library/ms143432.aspx
http://msdn.microsoft.com/en-us/library/ms187030.aspx
-
In PostgreSQL, the maximum number of connections can be set in the max_connections property of the PostgreSQL.conf file. It is recommended to also check the value of work_mem. Changing any of these values requires that the database engine be restarted. More details can be found in the comments of the same PostgreSQL.conf file.
9. Integrations with External Systems
-
There is evidence that connecting to Active Directory using START_TLS may cause long connection timeouts which impacts application performance. It is recommended to use LDAPS instead. In general, to address/troubleshoot LDAP connectivity issues, it is best to try to connect without security first, then try to enable security without verification, and finally, if all that works and performs well, then attempt to enable secure communication verification using a valid security certificate.
10. Record Current Performance Benchmarks and hardware values
- Using the attached form, "FP12 Performance Report Checklist.docx", document the performance after making the suggested changes above. This will be helpful to compare the current performance with the performance in the future. Comparing this information between agents, historical, and the difference over time will be helpful for troubleshooting with support in the future.
|